IN-DEPTH PAGE · linked from the "Service" section of the main website
Technical deep dive
How the Artesis check-up works: predictive diagnostics explained in plain language.
Seven independent analysis dimensions, a traffic-light colour code, an operational technical report. All from a single measurement of the motor's electrical signature — no sensors on the machine, no plant shutdown, no physical access to the rotating parts.
7
Independent analysis dimensions
~7 min
Per asset, from the MCC panel
0
Sensors on the machine
10M+
Motors in the AI reference dataset
The technology
The motor's electrical signature: ten million patterns, one measurement
Rather than fitting accelerometers or probes to the machine, we read the electrical signal already flowing through the motor's supply cable. It carries far more information than most people realise.
When an AC electric motor is running, the drawn current and supply voltage contain much more than instantaneous power: they carry the "signature" of everything happening mechanically and hydraulically on the driven machine. A deteriorating bearing modulates the current at a specific frequency. An impeller in cavitation produces a clearly recognisable high-frequency spectrum. A coupling misalignment causes harmonics to appear at precise positions.
Our instrumentation captures these signals via current transformers and voltage probes fitted at the motor's electrical distribution panel — metres away from the machine itself, often in the switchroom. From there it is all signal processing and machine learning, trained on the Artesis dataset of over ten million real motors collected over 25 years of worldwide operations.
The practical implication is significant: with a single accessible measurement point (the MCC panel), we can diagnose submersible pumps at 150 metres' depth, motors in ATEX zones, or assets confined in hazardous environments — without fitting accelerometers to the rotating parts, without shutting down the plant, without any physical access.
Motor in operation
The asset runs normally: no shutdown, no bypass, no special switching procedure.
→
MCC panel
Current transformers and voltage probes connected to the motor cables — a few minutes' work.
→
AMT Pro acquires data
The portable system records ~7 minutes of high-resolution electrical signature: voltage, current, power, power factor.
No accelerometers, no wiring, no sensor maintenance — sensors themselves can fail. Everything from the MCC panel.
~7 minutes
Per asset
Typical acquisition time for one machine. Enables campaigns of up to 20 motors per day with a single field technician.
10M+ motors
In the AI reference dataset
The algorithm classifies anomalies by comparing your motor's signature against a population dataset far larger than any single asset.
What we measure
Seven analysis dimensions from a single measurement
Every asset is evaluated across seven independent dimensions, each rated with a colour code (green / yellow / red) for intervention priority. Click to read the detail of each one.
Baseplate not solidly fixed to the supporting structure
Vibrations at frequencies typical of mechanical looseness
Slack mechanical components or components outside tolerance
Field example
Water utility case · AMT Pro campaign
Loose Foundation detected at Caution status on Marconi P.Industriale 1, Selva P2 KSB and Via Gentile P2: the signature indicates mechanical play at the baseplate or yielding anchors. Operational recommendation: check tightness of foundation bolts and verify structural rigidity before the next scheduled shutdown.
What this means for your machine
A yielding foundation amplifies the vibrations the motor transmits to the system, accelerating wear on bearings, seals and couplings. It is often a problem fixable in a few hours at very low cost — but left unaddressed it cascades into far more expensive components.
2. Unbalance
Rotor imbalance, loss of dynamic balance.
What we detect
Dynamic rotor imbalance (mass not perfectly balanced)
Loss of balance over time (due to deposits, erosion, repairs)
Phase current imbalance (indicator of electrical or load issues)
Field example
Water utility case · 13 pumps
Current imbalance 1.73% detected on Via Gentile P2 — the highest value in the analysed fleet (from a single AMT Pro measurement). Below the critical threshold of 5% but to be monitored in subsequent periodic measurements: growth beyond 2.5% would signal active mechanical or electrical deterioration.
What this means for your machine
Unbalance generates radial forces that wear down bearings and seals. It can be resolved with a scheduled rebalancing job — typically a few hours' work, achievable within existing planned shutdown windows, without any unscheduled stoppages.
3. Transmission
Coupling misalignment, belt and pulley wear, drivetrain problems.
Mechanical coupling problems between motor and load
Recurring spikes caused by mechanical impacts on the drivetrain
Field example
Water utility case · 3 e-MCM units under continuous monitoring
On Pump1 at a pumping station: the Transmission/Driven Equipment band shows recurring spikes, typical of water-borne debris striking the pump impeller. Continuous monitoring clearly distinguishes these transient events (impacts) from sustained structural deterioration (belt/coupling wear). Recommendation: inspect the upstream filtration system.
What this means for your machine
A misaligned or worn transmission can reduce efficiency by up to 5% over time, and generates vibrations that propagate throughout the system. It is often the first "bridge" through which a small problem becomes a major failure.
Bearing outer race defects (BPFO — Ball Pass Frequency Outer)
Inner race defects (BPFI — Ball Pass Frequency Inner)
Ball or roller defects (BSF — Ball Spin Frequency)
Bearing cage defects (FTF — Fundamental Train Frequency)
Insufficient or incorrect lubrication
Incorrect bearing type selection for the applied load
Field example
Water utility case · e-MCM continuous monitoring
On Pump3 at a pumping station: BPFO + BPFI + FTF all confirmed on bearing model 6213 — the signature is clear and growing over time (4 months of continuous trend). The system has already estimated time-to-failure at a confidence level sufficient to schedule the intervention at the next planned shutdown, avoiding unplanned stoppages.
What this means for your machine
Bearings are the single component responsible for the most failures in AC motors and pumps. Identifying them months in advance means: bearing replaced during a planned 30-minute shutdown vs destroyed rotor due to overheating after 8 hours of unplanned downtime.
5. Rotor
Broken rotor bars, end rings, static and dynamic eccentricity.
What we detect
Cracks or breaks in rotor bars (broken rotor bars)
Defects in short-circuit end rings
Static and dynamic rotor eccentricity
Internal electromagnetic imbalances
Field example
Glassworks case · 30 fans
No active rotor fault detected across the glassworks fleet — a sign that assets are well maintained from an electromechanical standpoint. All identified issues (€54,000/year in excess costs + 77 t CO₂/year) are concentrated in transmission, bearings, foundations and efficiency optimisation, not rotor problems.
What this means for your machine
A rotor failure is a catastrophic event: the motor trips on thermal protection due to overheating, and in the worst cases the stator insulation is destroyed. Early diagnosis makes the difference between "replace rotor" and "buy a new motor".
6. Stator
Insulation degradation, inter-turn short circuits, voltage imbalances.
What we detect
Stator insulation degradation
Inter-turn short circuits within the same phase
Voltage and impedance imbalances between the three phases
Electrical anomalies of external origin (supply network, cable, terminal block)
Field example
Water utility case · 13 pumps
No pump in the analysed fleet shows an active rotor/stator signature. Voltage imbalances ≤0.10% and current THD <2% across the entire fleet — the network upstream of the inverters is healthy, and no motor shows imminent stator problems. All identified faults are mechanical-hydraulic in nature.
What this means for your machine
Stator problems are slow but irreversible: once the insulation has degraded there is no going back. Early detection enables a structured rewind to be planned, rather than reacting to a sudden failure.
7. Hydraulics & Other
Cavitation, blockages, discharge and suction obstructions, motor overload.
What we detect
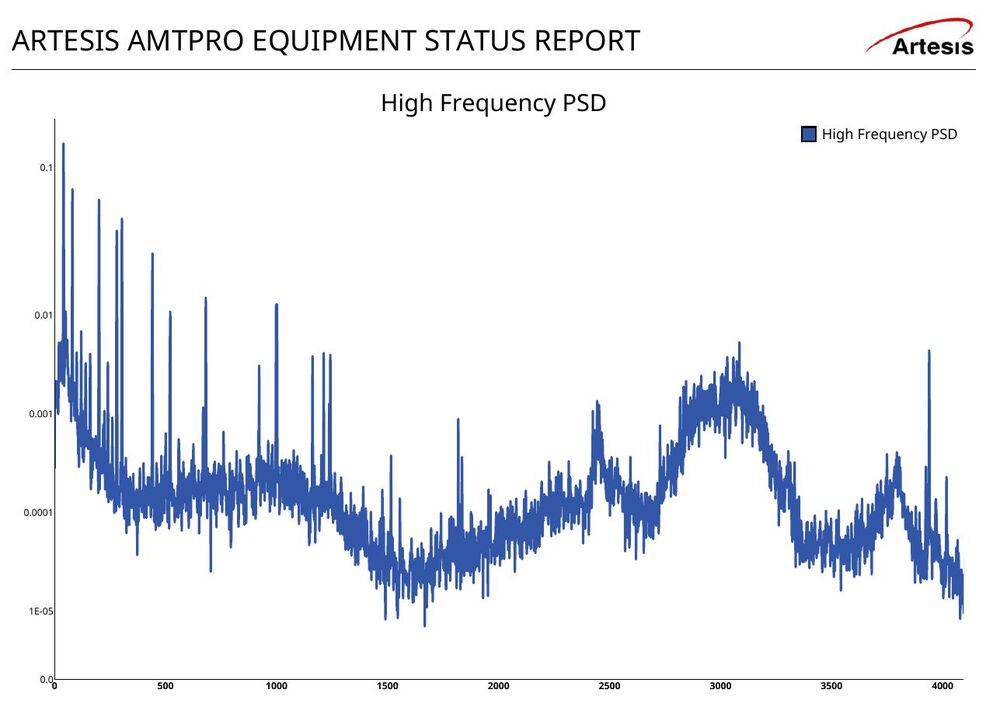
Active cavitation on the impeller (signature 1,800–3,000 Hz in PSD)
Discharge or suction obstructions (transient events captured live)
Operation far from the best efficiency point (BEP)
Motor overload (above 100% of nameplate rated load)
Specific hydraulic anomalies (flow turbulence, blade-pass)
Field example · 1
Water utility case · e-MCM continuous monitoring
On Pump2: active cavitation confirmed by PSD spectral analysis in the 1,800–3,000 Hz band, with a worsening trend observed over 4 months of monitoring. A discharge obstruction event was captured live on 9 January 2026 — a valuable timestamp for intervention planning. Operational recommendation: check available NPSH and inspect impeller and volute.
Field example · 2
Water utility case · 13-pump campaign
On one civil water pump: 110% of the motor's nameplate load. If sustained, this condition accelerates bearing and seal wear in a non-linear fashion and stresses the stator insulation. Recommendation: shut down at the first opportunity, verify hydraulic sizing and carry out a full inspection.
What this means for your machine
Hydraulic anomalies are the most common faults in pumping and ventilation systems, and often the ones with the greatest impact on energy consumption. A pump operating at 59% of BEP can consume 15–20% more than necessary — and that 15–20% is exactly the efficiency margin recoverable with a targeted intervention (impeller trim, resizing, process adjustment).
Colour code
Green, yellow, red: three bands, immediate operational decisions
The Artesis report rates every dimension on a traffic-light scale. It is the fastest way for anyone managing a motor fleet to see where action is needed and where it is not — without needing to be a spectral signature specialist.
Normal
All clear · OK
Parameters within statistical threshold. No anomaly detected in the electrical signature. Asset in normal health — no action required.
Caution / Watch Load
Monitor
Parameter above the attention threshold. Check at the next monitoring cycle. No immediate action required, but the trend should be followed to distinguish a transient symptom from active deterioration.
Examine / Do Maintenance
Immediate action
Fault already present (Watch Existing Faults). Schedule an inspection and corrective action at the next available maintenance window, or take immediate action if severity demands it.
Operational advantage: the maintenance manager opens the report and within 30 seconds knows which assets are red-priority, which are under observation and which are "clean". No spectral interpretation required, no PhD in vibration analysis. Just decisions.
The report you receive
Four pages, concise and operational
At the end of the check-up the client receives a technical document structured to answer the real operational questions a maintenance manager faces — not the academic ones of a scientific conference.
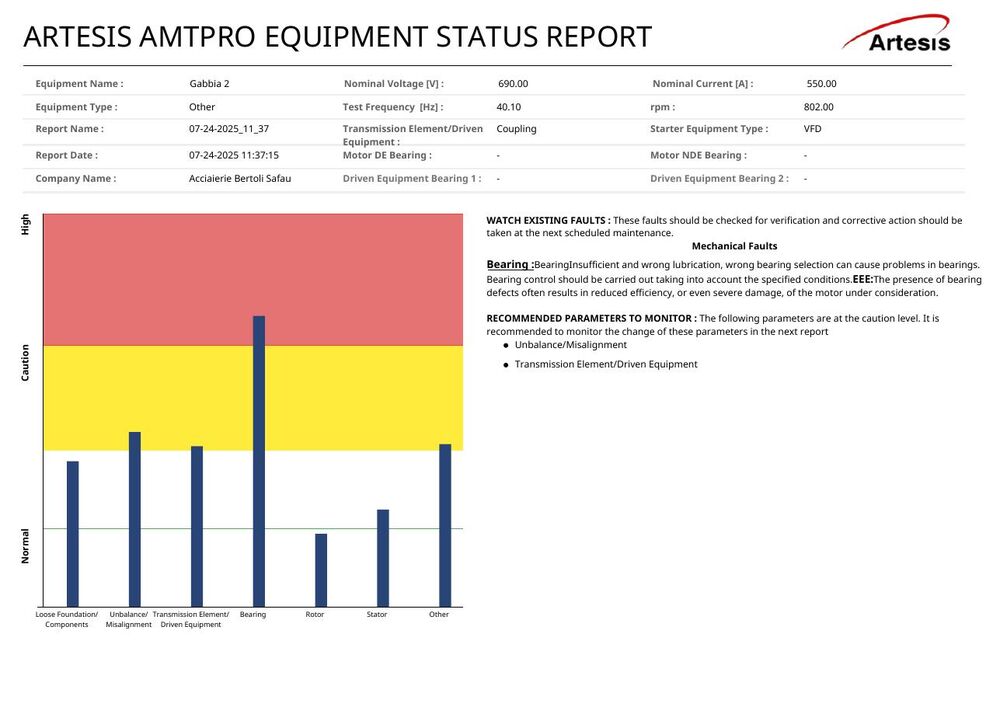
Page 1
Equipment Status — the 7-dimension dashboard
The bar chart showing the 7 dimensions rated green / yellow / red. Below: the automatic diagnosis referencing dimensions in caution and the recommended corrective actions. This is the first page anyone looks at in the report.
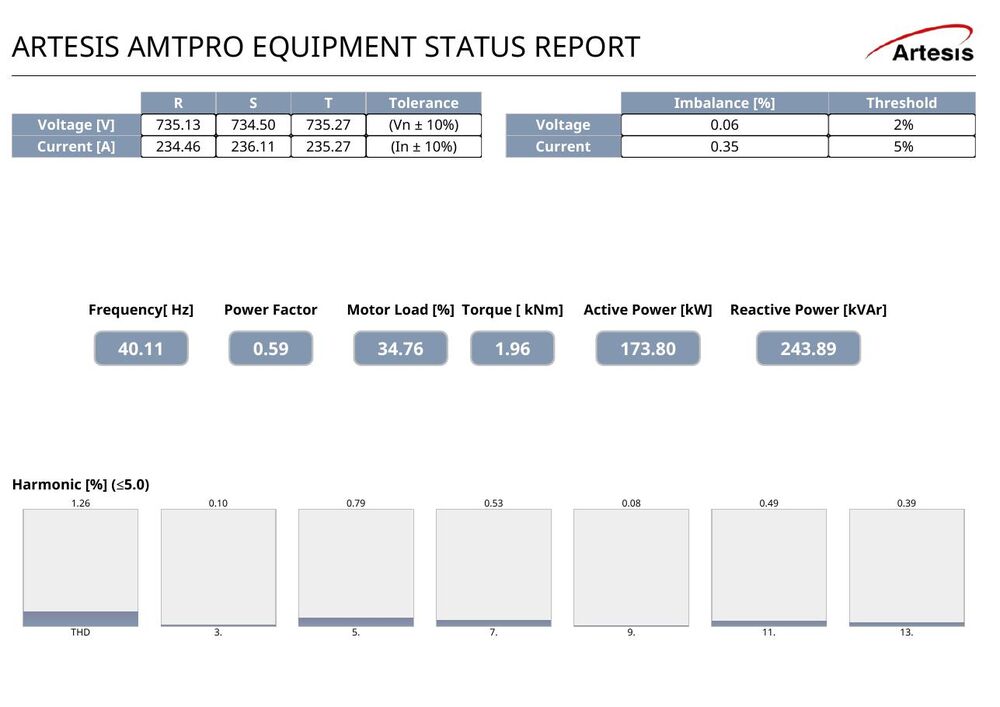
Page 2
Equipment Information & Power Status
Motor nameplate data (make, efficiency class, annual running hours) and a comparison of rated vs measured values for voltage, current, power, power factor, RPM and efficiency. Below: total energy consumption and annual cost.
Page 3
Effect of Detected Faults on Energy Cost
A table quantifying for each detected anomaly the energy impact in kWh/year and the additional cost in €/year. This is the page you take into the boardroom to present to the CFO: concrete numbers, not promises.
Page 4
Equipment Comparison & Recommendation
Comparison between the existing motor and IE3 / IE4 high-efficiency alternatives, including calculation of annual energy savings, avoidable annual cost and CO₂ emission reduction. This is where the diagnosis becomes a documented investment case.
What happens next
From check-up to continuous monitoring, in three phases
The check-up is the starting point. The subsequent phases are independent and are only activated if the data from the previous phase justifies them. No upfront commitment to later phases.
01
On-site check-up
In-depth assessment of motors, pumps and fans with AMT Pro. Technical report with actual condition and operational recommendations. Documented baseline that serves as a reference for every future decision.
Month 1–3
02
Periodic portable diagnostics
Repeated advanced diagnostics over time with AMT Pro (typically every 6 months). Historical trends to distinguish transient symptoms from real deterioration. Up to 20 motors per day with a single field technician.
Month 3–6
03
24/7 continuous monitoring
Fixed e-MCM system installed at the panel on the most critical assets, with a self-learning digital twin. Real-time alarms for cavitation, bearings and electrical anomalies. SCADA / BMS / remote-control integration.
Month 6–12
Ready to get started?
Request the Artesis check-up for your asset fleet
A free, no-obligation 30-minute introductory call with one of our engineers. We review your plant together, assess the potential and propose the check-up best suited to the number and criticality of your assets.